January was all about assessing our current carbon footprint.
First, we looked up our fuel consumption. This was easy. Enmax, our electricity and natural gas provider, has an on-line service that totals and graphs consumption. One stop data.
For our two cars, we calculated our annual average mileage, and inputted model information. The on-line carbon footprint calculators worked out the rest. This will be based on official mileage for those vehicles, not our actual mileage, as we haven’t kept data on that. We will collect it this year.
We used two calculators to calculate our carbon footprint. The first, recommended by the Suzuki Foundation, focuses solely on fuel use.
https://treecanada.ca/en/programs/grow-clean-air/carbon-calculator/#tabs1-energy
Based on this, our carbon footprint is 20.34 metric tons of CO2. This is for 3 people in a 1200 sq ft house, no basement, detached unheated garage, in inner city Calgary.
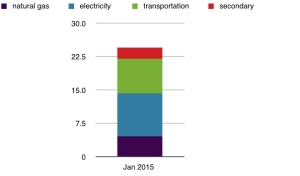
However, we also wanted to include secondary carbon, from making and transporting the goods and services we use, so we looked at other websites, and chose
http://www.carbonfootprint.com/calculator.aspx
It’s easy to use, to reset, and to play with, and it breaks down the various categories clearly. The two calculators came up with the same carbon footprint for fuel consumption.
Our total carbon footprint including secondary consumption is 24.42 metric tons of CO2, for three people.
The average for Canada is 20 metric tons per person. Compared to that we’re doing really well. The average for the industrial world is 11 (we’re still doing well compared to that), worldwide average is 4 (we’re double that), and the worldwide target to combat climate change is 2. Ideally, we need to reach carbon zero.
Our first surprise – that our energy footprint as low as it is. Of course, that’s a relative thing. It’s still far, far too high.
The reasons it’s low compared to average? None of us drive to work or school (we’re in a walkable bikeable transitable neighbourhood). We live in a small house. We’ve made some changes over the years, like installing an efficient furnace, replacing old single-paned (multi-paned mullioned windows) with argon-filled double paned windows, and choosing efficient appliances as they need replacing.
Our second surprise – that our natural gas use is lower than average for our area, but our electricity use is higher. This one has us scratching our heads. Our guess is that this is a reflection of Maureen’s health issues. We run air filters through the year and a portable air conditioner on the hottest days to help with air quality. We’ll try to break this down further when we look at electricity use.
Note: Calgary’s electricity is generated in part by coal-fired plants, so our carbon footprint for electricity will be higher than for the same consumption in other provinces. The coal-fired plants are being phased out, but for now, it’s higher-carbon electricity. Our personal use is also higher than use in our area – that’s the piece we can work on.
The third surprise – we checked the price of carbon offsets. This is a purchase into someone else’s carbon sequestering project, to provide a carbon sink equal to our carbon use. For our current carbon footprint, this would cost $400ish, for the year. That’s it – that’s the yearly price for the three of us to get to zero carbon.
But that’s not the path we want to take. We want to reduce our carbon footprint. So to work.
In February we’ll focus on learning more about our natural gas consumption. We’ll test for drafts, and get an energy assessment. Hopefully we’ll learn what’s going on with our roof insulation, and discover why our poorly built back entry is so cold in deepest winter. We’ll also look at the efficiency of our furnace and water heater.
We were hoping to rent a thermal camera and play, but it turns out the rental from Home Depot is only available in the US. Alas. No geek out play time for us. We’ll have to be satisfied with a report.
Maureen and Mark
Here are some links we found useful for learning about reducing our carbon footprint:
http://www.davidsuzuki.org/what-you-can-do/reduce-your-carbon-footprint/
http://www.atcoenergysense.com/For-Homeowners/Tools-and-Calculators/
We used calculators that worked in different units of measure than our data. We googled the conversions, but if you want a chart, here’s one we bumped into:
http://www.atcoenergysense.com/For-Homeowners/Tools-and-Calculators/Energy-Conversion-Table